> ## Documentation Index
> Fetch the complete documentation index at: https://data.ornn.com/docs/llms.txt
> Use this file to discover all available pages before exploring further.
# Chart prices in JavaScript
> Fetch a GPU price series and render it in the browser.
This guide fetches an H100 SXM price series and prepares it for a chart in the browser.
## Prerequisites
* A browser origin allowed by the Ornn API's CORS configuration, or a server-side proxy you control.
Public access means the free-tier [`/index-history`](/docs/api-reference/historical-prices/get-a-public-daily-series) data needs no key for server-to-server requests. It does not allow every website to call the API directly: browser CORS checks reject unlisted origins. Use your own backend for a third-party site, and never embed an API key in browser code.
## Fetch the series
The direct browser request below works only from an origin configured by Ornn. The dates are computed at runtime to remain inside the trailing 3-month public window:
```javascript theme={null}
const BASE = "https://api.ornnai.com";
function isoDate(daysAgo) {
const value = new Date();
value.setUTCDate(value.getUTCDate() - daysAgo);
return value.toISOString().slice(0, 10);
}
async function getSeries(gpu, startDate, endDate) {
const url = new URL(`${BASE}/api/gpu/${encodeURIComponent(gpu)}/index-history`);
url.searchParams.set("startDate", startDate);
url.searchParams.set("endDate", endDate);
const res = await fetch(url);
if (!res.ok) throw new Error(`Request failed: ${res.status}`);
const { data } = await res.json();
// Sort ascending and shape for a charting library
return data
.map((p) => ({ x: new Date(p.timestamp), y: p.index_value }))
.sort((a, b) => a.x - b.x);
}
const startDate = isoDate(30);
const endDate = isoDate(0);
const series = await getSeries("H100 SXM", startDate, endDate);
console.log(series[0]); // { x: Date, y: index_value }
```
## Render with Chart.js
```javascript theme={null}
import Chart from "chart.js/auto";
const points = await getSeries("H100 SXM", startDate, endDate);
new Chart(document.getElementById("price-chart"), {
type: "line",
data: {
datasets: [{ label: "H100 SXM (USD/hr)", data: points }],
},
options: {
scales: { x: { type: "time" }, y: { title: { display: true, text: "USD per hour" } } },
},
});
```
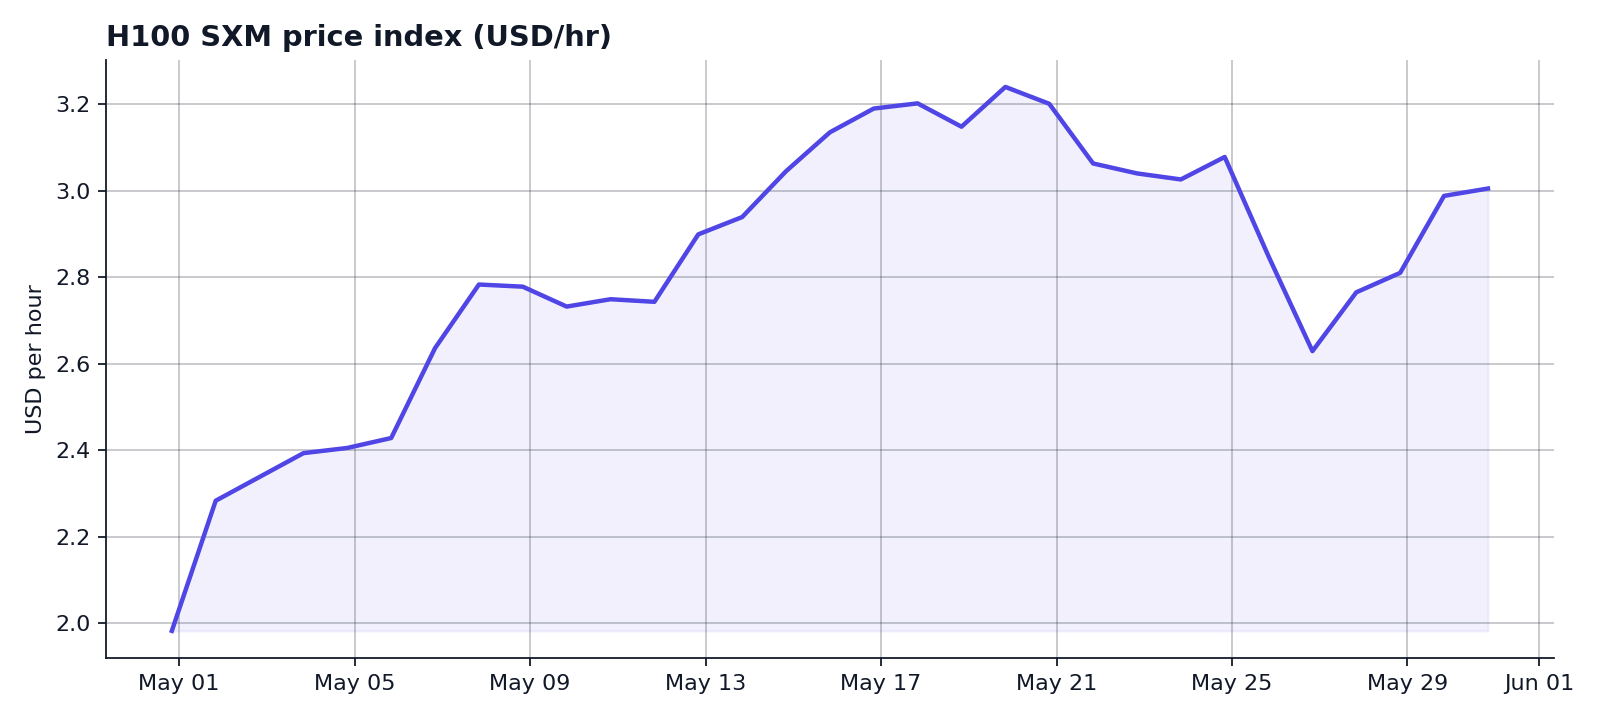
 For authenticated endpoints (analytics, full history), put the `Authorization: Bearer` request on your server and forward only the data to the browser.